

DORA Really Needs Some SPACE
The "what" and "why" between DORA and SPACE as developer productivity signals and how best to apply them.

Too frequently, when the topic of developer productivity metrics comes up, DORA metrics are the first (and often the only) framework that gets mentioned. We in the software engineering community are over-indexing on DORA metrics. Too much value is being placed on these specific signals and we’re missing the bigger picture.
To be clear, I am not anti-DORA metrics. The metrics are valuable, the research behind them is solid, and they were a genuinely important step forward for our industry. DORA metrics have become the de facto means of measuring developer productivity for many teams and organizations. However, the “DORA 4” (now 5, more on that later) are not a complete measure of productivity, and treating them as such leads to real blind spots: blind spots around developer well-being, around collaboration, around whether the work we’re shipping actually matters to anyone. Used on their own, DORA metrics tell you part of a story and you would be mislead if you think you’ve heard the whole thing.
A quick refresher on DORA
For those who haven’t run into DORA metrics yet, they were first introduced in the book Accelerate - The Science of Lean Software and DevOps: Building and Scaling High Performing Technology Organizations by Gene Kim, Jez Humble, and Nicole Forsgren, published March 27, 2018. The book is based on extensive research from the DevOps Research and Assessment (DORA) studies, which statistically links specific practices to high-performing technology organizations.
Prior to DORA metrics, our industry had really struggled to accurately measure developer productivity. We kept falling into the trap of using a single metric, like lines of code or story points, to judge engineering performance. DORA metrics gave us something concrete to measure across multiple dimensions, grounded in research rather than gut feel.
The framework defined four key metrics for measuring software delivery performance:
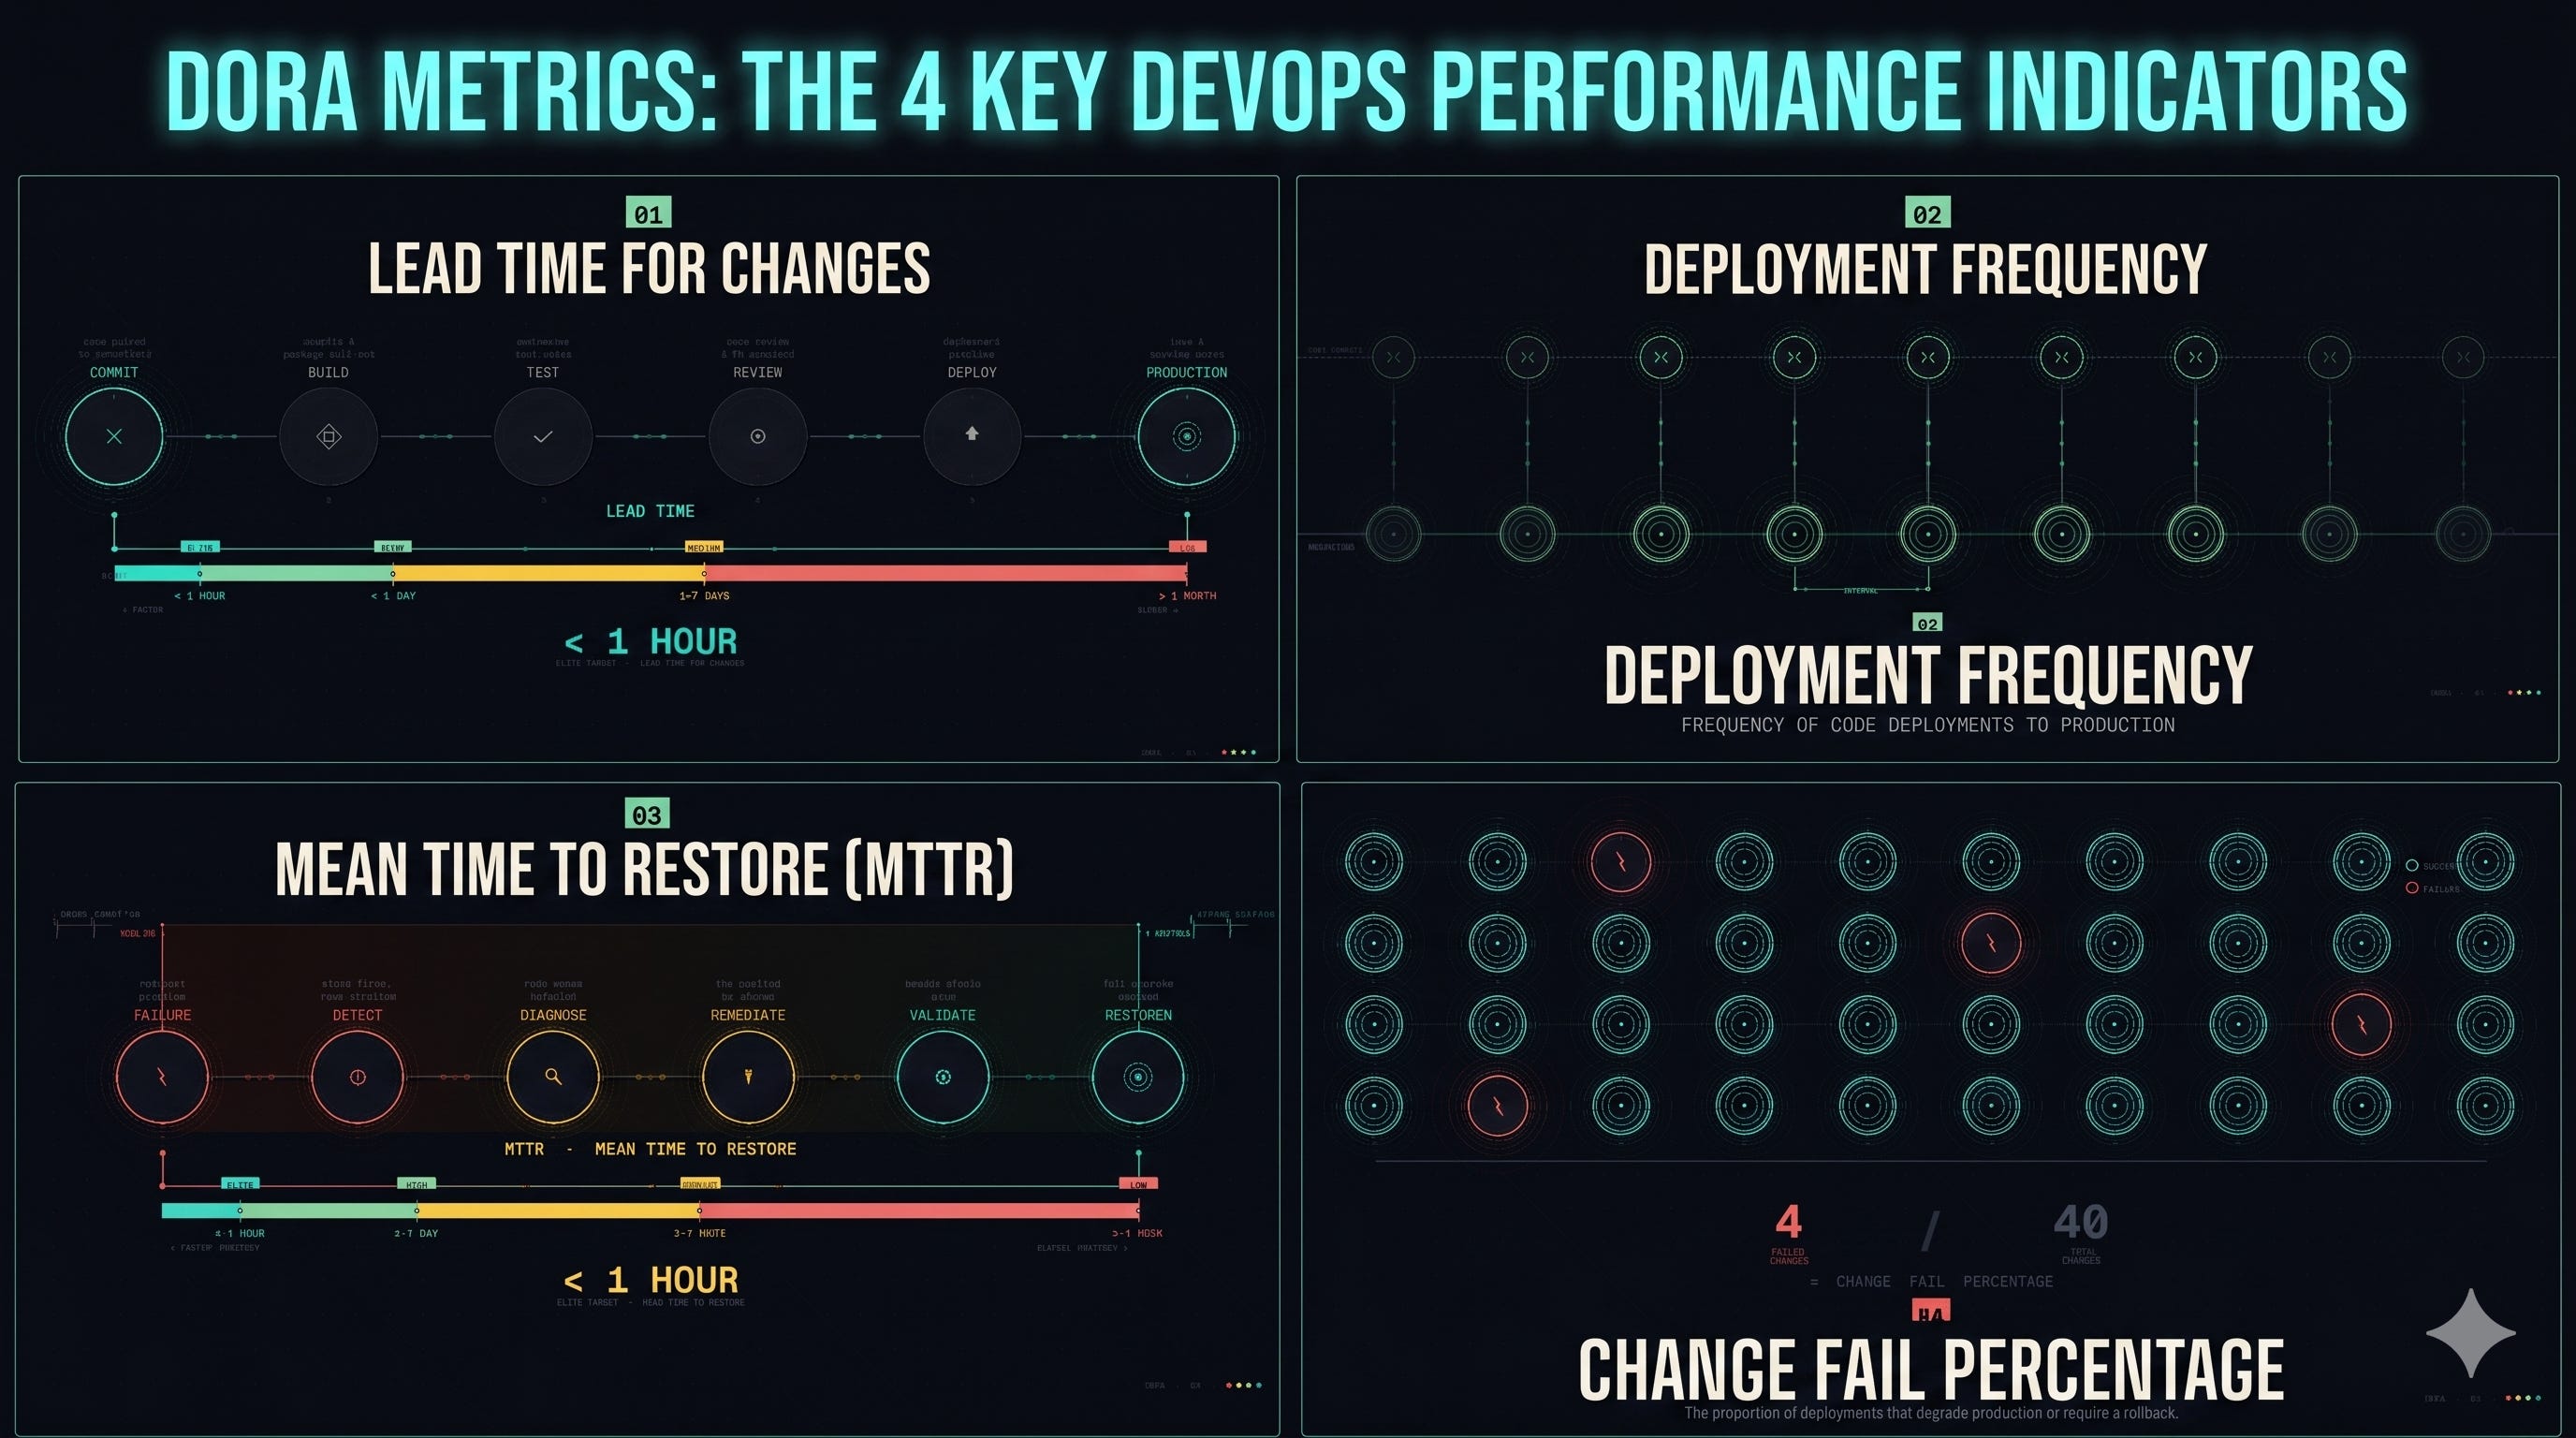
Deployment Frequency: how often does the team release to production?
Lead Time for Changes: how long does it take a commit to get to production?
Change Failure Rate: of all releases, how many contain a defect?
Mean Time to Recovery (MTTR): how long does it take to recover from a failure in production?
And later, in 2024, the DORA researchers added a fifth metric:
Rework Rate / Reliability: The ratio of unplanned work, such as hotfixes or patches, needed after a deployment.
Why DORA metrics caught on
I think there are a few reasons DORA metrics became so well known so quickly:
They’ve been around long enough to build credibility.
It was our first real attempt at measuring productivity across multiple dimensions, and it gave us something concrete we could finally track and draw conclusions from.
They’re research-backed and outcome-oriented.
The metrics come out of years of Accelerate / State of DevOps research and correlate with organizational performance in a way that vanity metrics like commits or story points never have.
They balance throughput with stability.
Throughput metrics (deployment frequency, lead time) are paired with stability metrics (change failure rate, MTTR), so you can’t trivially optimize one without hurting the other. Gaming a balanced framework is much harder than gaming a single-axis one.
DORA metrics are team-level, not individual-level.
This critically discourages stack-ranking developers, which avoids a lot of well-known dysfunction. Anyone who has watched leadership try to compare engineers using individual metrics knows how toxic that gets.
The metrics are largely automatable.
Most of them can be derived directly from CI/CD pipelines, version control, and incident tooling, with low overhead and no self-reporting bias.
Improving them tends to drag a team toward genuinely good practices.
Smaller batches, trunk-based development, automated testing, better observability, and faster rollback paths. These are a really nice side effect.
Where DORA metrics fall short
For all of those reasons, I think DORA metrics earned their reputation. However, we’ve been treating them as the answer when they were really only ever part of the answer.
They measure delivery, not value.
Shipping the wrong thing ten times a day still scores “elite” for DORA metrics. There’s nothing in the framework about customer outcomes, revenue impact, retention, or product-market fit. A team can be a high performer on paper while building things no one wants.
They ignore code and product quality beyond defects that escape to production.
Maintainability, architectural health, accessibility, security posture, tech debt — none of that is visible. A codebase can rot quietly while DORA dashboards stay green.
They say nothing about developer experience.
Burnout, cognitive load, onboarding time, flow state, satisfaction, and all the other things that truly impact a developer’s ability to be productive are all absent.
They’re gameable in subtle ways.
Splitting one deploy into ten, reclassifying incidents as “not real” outages, defining lead time from the convenient commit, excluding rollbacks from the change failure rate calculation. I’ve seen all of these happen, and not necessarily out of malice. Teams under pressure to hit numbers will find the easiest path.
They’re context-blind across teams.
A platform team, an ML research team, an embedded/firmware team, and a SaaS web team have wildly different baselines. Cross-team comparisons mislead more than they inform.
They can incentivize small, safe changes.
A risky refactor or a multi-week migration looks bad on lead time and change failure rate even when it’s the right call for the long-term health of the system.
They’re silent on collaboration, mentoring, and knowledge sharing.
These are the things that determine whether a team is growing and thriving, rather than just surviving.
And maybe most importantly: “productivity” is the wrong word for what DORA metrics measure. DORA metrics measure software delivery performance. Treating that as productivity is a category error that leadership often makes, and it tends to flatten engineering work into a throughput problem. Laura Tacho put it well in an interview with Gergely Orosz on The Pragmatic Engineer:
DORA metrics aren’t intended to measure the productivity of teams, and certainly never intended to measure the productivity of individuals. They began as a way to benchmark DevOps adoption across the industry, and measure the performance of delivery practices.
Even Nicole Forsgren, one of the original DORA researchers, has been clear about the framework’s limitations. In a February 2025 interview with Gergely Orosz, she said:
One thing I always try to point out is that DORA only goes from commit to production. Now, back when we were starting this, this was like 2013. That end-to-end software systems had not been studied very much and measured because it’s so, so difficult to measure them. And so we focused on that part of the engineering system because we thought we could have some really good impact, deliver some good insights.
DORA tells you the pipeline is healthy. It doesn’t tell you you’re building the right thing, or that the people building it will still be there in a year.
Enter SPACE
This is where the SPACE framework comes in. SPACE was introduced in the paper “The SPACE of Developer Productivity: There’s more to it than you think” by Nicole Forsgren, Margaret-Anne Storey, Chandra Maddila, Thomas Zimmermann, Brian Houck, and Jenna Butler, published March 6, 2021.
The authors describe how, for decades, our industry had been struggling to measure developer productivity, often resulting in teams and managers desperately searching for “one metric that matters” to evaluate performance. SPACE was developed specifically to combat several pervasive myths:
The trap of activity metrics. The myth that productivity is just about developer activity, like commit counts or lines of code. As the paper notes, high activity volumes can actually be a sign of systemic dysfunction, indicating that developers are having to brute-force their way through poor planning or bad engineering systems just to meet a deadline.
Ignoring “invisible” team work. Vital collaborative tasks like code reviews, mentoring, knowledge sharing, and morale building are often rendered invisible because standard metrics fail to capture them.
Overlooking human factors and well-being. The misconception that productivity is only a matter of optimizing engineering systems and tools, while ignoring work culture, environment, and developer well-being.
Metrics as a top-down management tool. Historically, productivity measures were seen as something only managers cared about, which led to developers feeling that metrics were weaponized.
The urgency to develop SPACE was also heavily influenced by the COVID-19 pandemic. Some organizations early in the pandemic saw an uptick in pure activity metrics like commits and PR merge speeds, and through a single-metric lens it looked like productivity was increasing. However, qualitative data revealed that many developers were actually struggling and approaching burnout. SPACE was created to expose those dangerous blind spots.
The Five Dimensions of SPACE
SPACE divides developer productivity into five core dimensions. The whole point is that you look at metrics in tension across multiple dimensions, rather than relying on a single proxy.
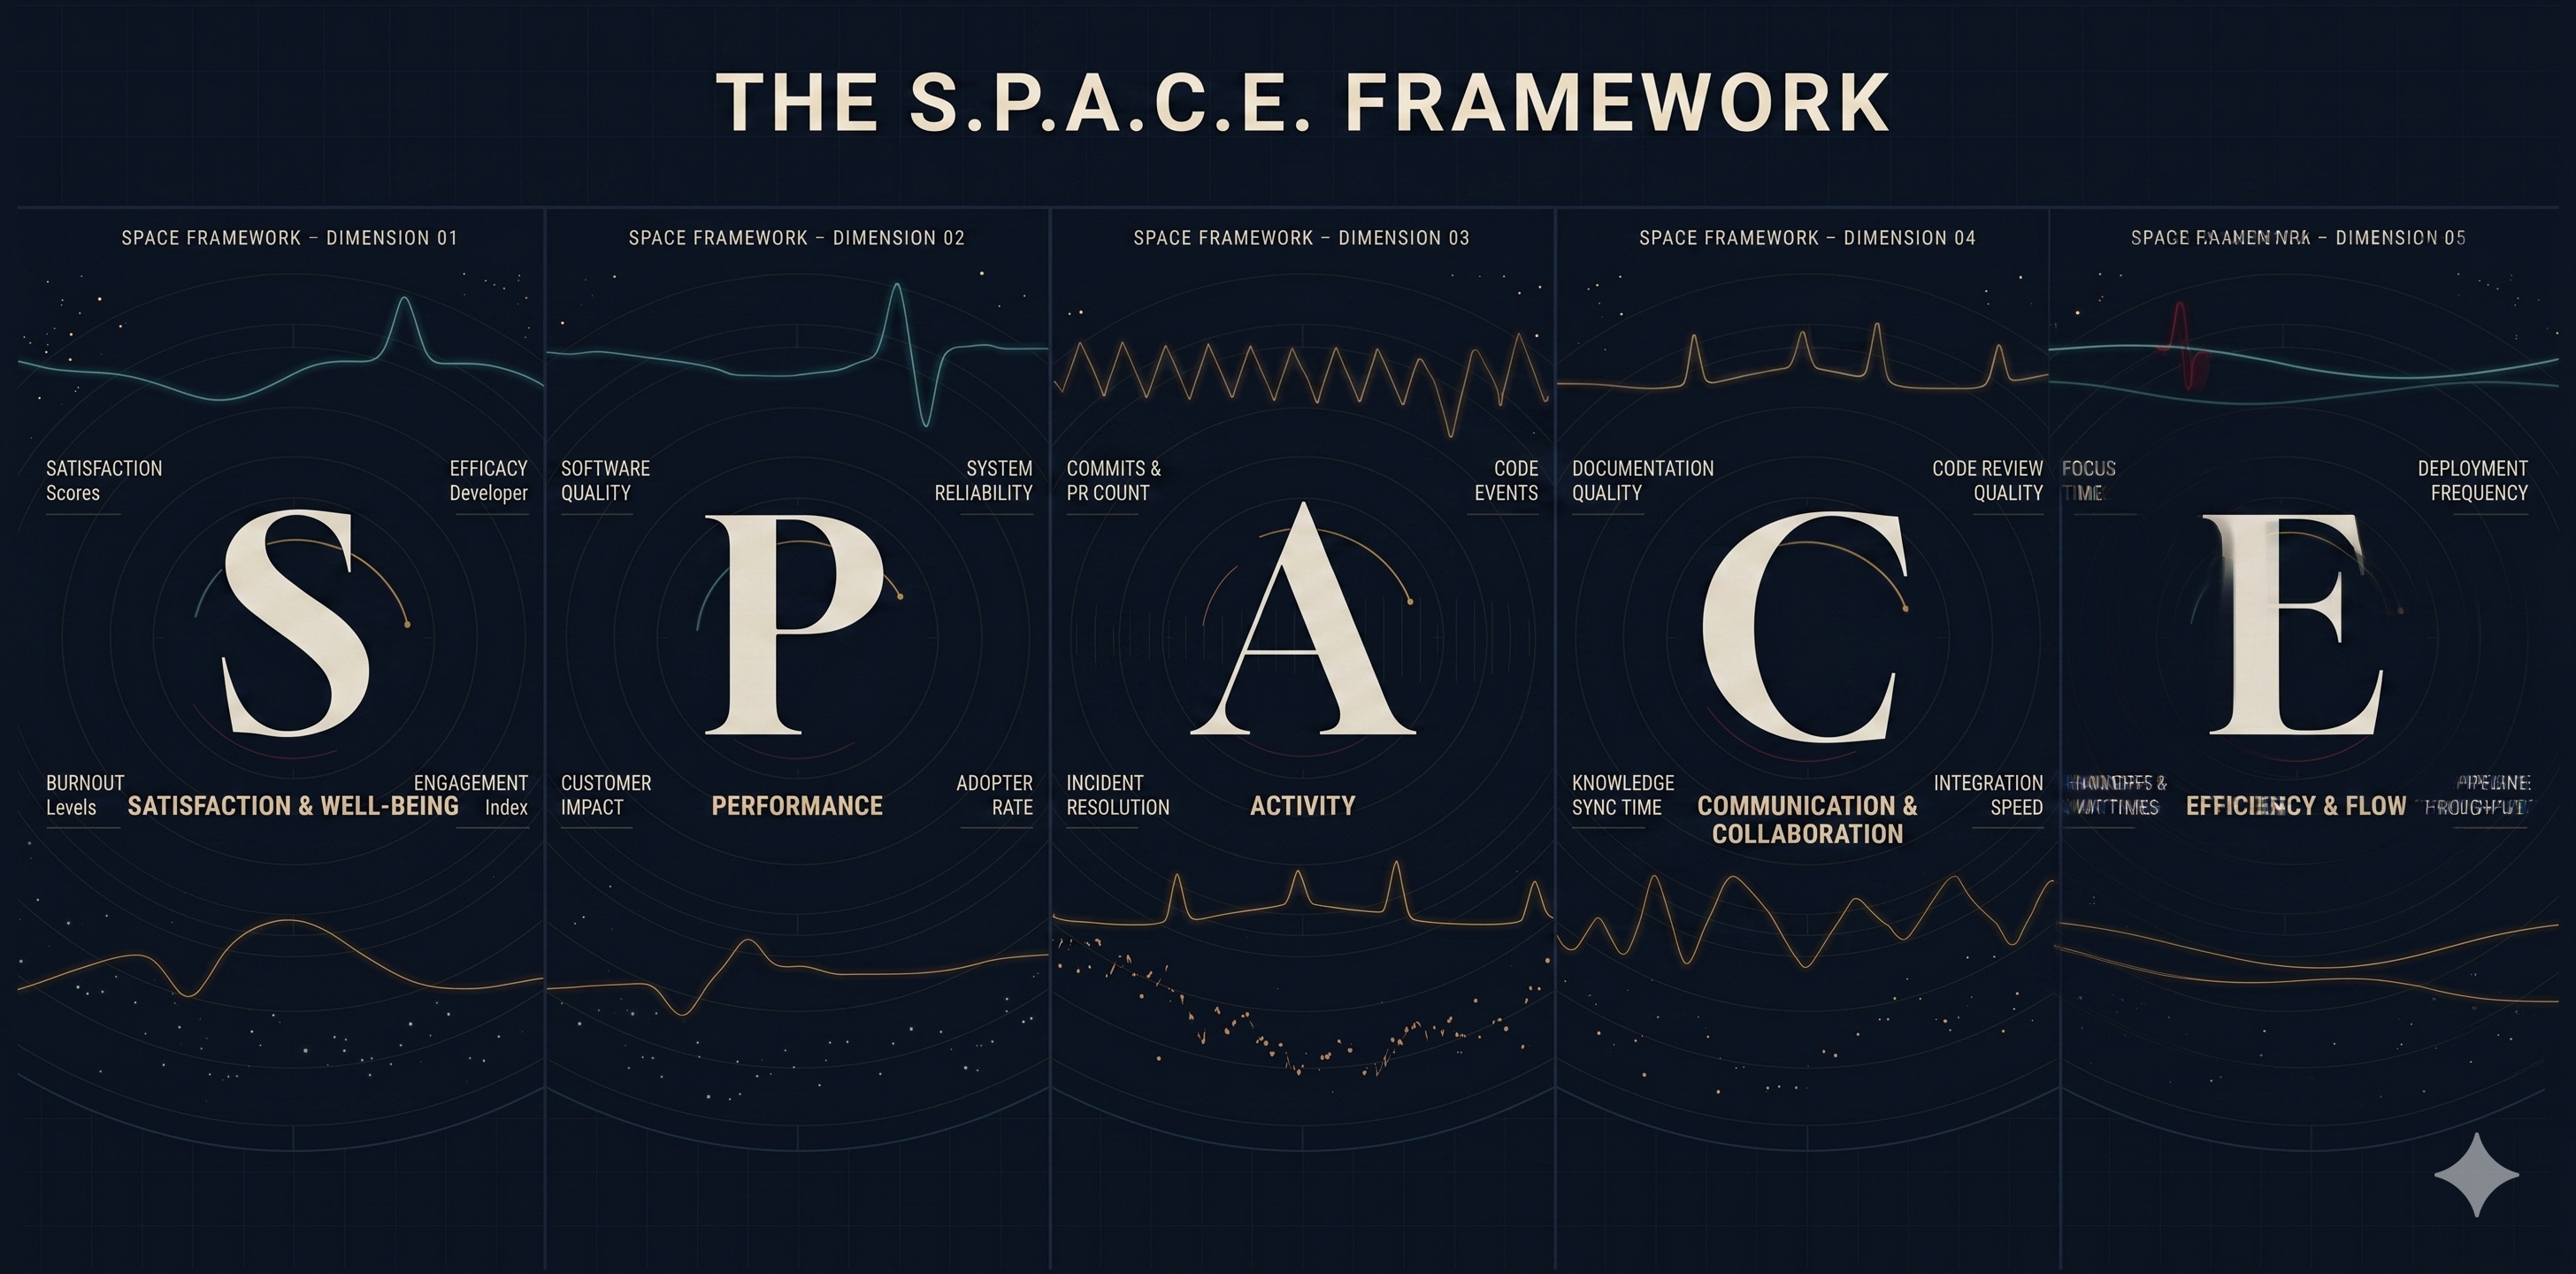
S — Satisfaction and Well-being
This dimension assesses how fulfilled, healthy, and happy developers feel at work. The paper makes the case that satisfaction is a crucial leading indicator for productivity. If engagement drops, burnout and reduced output often follow.
Good metrics for this dimension include employee satisfaction scores, developer efficacy (do you have the tools and resources you need?), and burnout levels. These are typically gathered through surveys rather than telemetry, which is something I think we under-value as an industry.
P — Performance
Rather than focusing on raw output, this dimension evaluates outcomes. Because it’s difficult to tie an individual developer’s code directly to business outcomes, performance is best measured by asking whether the code reliably did what it was supposed to do.
Metrics include software quality, system reliability, and customer impact or adoption. This is the dimension that actually answers “did this work for our users,” which is something DORA metrics largely sidestep.
A — Activity
This captures the count of actions or outputs: commits, pull requests, CI/CD events, incident mitigations, and so on.
The framework strongly warns that activity metrics should never be used in isolation to reward or penalize developers, because they don’t capture the full picture of someone’s work and are easily skewed by things like crunch time or unrecorded collaboration. Activity tells you something, but it doesn’t tell you whether the something was valuable.
C — Communication and Collaboration
Software engineering is an inherently collaborative and creative task. This dimension captures how well teams work together.
Because collaboration is often invisible work, it gets measured using proxies: the discoverability of documentation, the quality of code reviews, onboarding time, and how quickly work is integrated. This dimension is the one that teams can often under-weight, and also the one that, I believe, predicts the long-term health of a team better than almost anything else.
E — Efficiency and Flow
This captures the ability to complete work with minimal interruptions or delays. For individuals, that means measuring uninterrupted focus time. At the team and system levels, it relates to the value stream: deployment frequency, the number of handoffs, and wait times in the software delivery pipeline.
This is the dimension where DORA and SPACE overlap most directly.
How to apply the SPACE framework
The SPACE paper offers a few critical implementation strategies that I think are worth highlighting.
First, measure across at least three dimensions. You shouldn’t try to track everything, because having too many metrics overwhelms developers and lowers motivation. Instead, capture a handful of metrics across at least three of the five dimensions to get a balanced view.
Second, combine telemetry with perceptual data. This one is important. You have to mix objective system data with perceptual measures (like surveys) to capture developers’ lived experiences. As Margaret-Anne Storey put it in a 2023 Pragmatic Engineer interview:
System data may be able to tell you how long code reviews take. But without perceptual data, you won’t know whether reviews are actually blocking developers and slowing down development, or whether developers are receiving high-quality feedback.
Third, recognize that metrics shape behavior. A core tenet of SPACE is acknowledging that what you measure signals what the organization values. If your team only measures Agile story points, developers are incentivized to optimize those numbers at the expense of vital collaborative tasks like mentoring and reviewing code.
So are DORA metrics still valuable?
I’m not arguing we should throw DORA out and replace it with SPACE. I’m suggesting that we can use both frameworks together, because they answer different questions.
In the same 2023 interview, Nicole Forsgren describes how the two frameworks fit together:
DORA helps teams and organizations improve their software-driven value delivery, and SPACE provides a framework for improving productivity. (Fun fact: DORA is an instance of SPACE, as a measure of the performance of software.)
That last point is a key insight. DORA isn’t separate from SPACE, it’s an instantiation of it. Deploy frequency is an Activity metric. Lead time to deploy is Efficiency and Flow. Change failure rate and MTTR are Performance. The two frameworks aren’t competitors, they’re nested.
Leading vs. lagging indicators
The other framing I find really helpful is thinking about these metrics in terms of leading vs. lagging indicators.
Lagging indicators measure outcomes that have already happened. They confirm whether something worked, but by the time you see the signal, the underlying cause is in the past. They’re high in reliability but low in actionability in the moment.
Leading indicators measure conditions or behaviors that predict future outcomes. They’re forward-looking signals you can act on before a problem fully manifests. They’re more actionable but inherently less certain.
A classic analogy: your blood pressure is a leading indicator of cardiovascular health, while a heart attack is a lagging one. Your blood pressure reading tells you something is trending wrong and gives you time to intervene. The heart attack confirms that something went wrong, but you’d rather not wait for it.
DORA metrics are primarily lagging indicators of delivery system health. By the time they move, the underlying conditions have already been in place for some time. Deployment frequency reflects the accumulated state of your CI/CD pipeline, branching strategy, and release process. Lead time is the end result of everything that happened between commit and production. Change failure rate is a lagging outcome of code quality practices, testing coverage, and review rigor. MTTR is the most purely lagging of all, measuring your recovery after something has already failed.
SPACE dimensions, especially Satisfaction and Well-being and Communication and Collaboration, tend to move before DORA metrics do. Developer satisfaction declining in survey data is a leading indicator of attrition, reduced engagement, and eventually degraded output quality. It will show up in your DORA metrics weeks or months later, if unaddressed. Rising context-switching and fragmented work predicts rising lead time before your dashboards catch it. Communication and collaboration breakdown (siloing, slow code reviews, poor knowledge sharing) is a leading indicator of rising change failure rate, because integration problems accumulate before they appear in deployments.
A Practical Stack
The most comprehensive approach may be with a three-tier indicator hierarchy:
Tier 1 — Leading (SPACE, especially surveys): satisfaction scores, flow state self-reports, collaboration health, cognitive load signals. These move first and give you time to intervene.
Tier 2 — Intermediate (DORA + SPACE Activity/Efficiency): PR cycle time sub-metrics, deployment frequency trends, CI pass rates. Lagging relative to the human and team conditions in Tier 1, but leading relative to business outcomes in Tier 3.
Tier 3 — Lagging (Business outcomes): customer satisfaction, feature delivery against roadmap, incident impact, revenue-correlated reliability.
If you’re only watching DORA metrics, you’re mostly reacting. You find out your lead time went up after it already went up. By the time MTTR is bad, you’ve already had the incidents. Adding SPACE’s leading indicators, particularly developer sentiment surveys, gives you a chance to see the conditions that cause degradation before it appears in your delivery metrics.
A team going through a painful migration or dealing with growing on-call burden will show declining SPACE Satisfaction scores first. That’s your signal to intervene: reduce on-call load, provide support, reconsider the migration scope. If you ignore it, the next thing you’ll see is rising lead time (developers are distracted and fatigued), then rising change failure rate (fatigued developers make more mistakes), and eventually MTTR spikes when the team is too burned out to respond quickly to incidents. Every one of those steps is predictable if you’re watching the right leading indicators.
Wrapping Up
DORA metrics have value. They were a massive step forward for our industry and they remain a worthwhile signal for the health of your delivery pipeline.
However, treating DORA metrics as the complete picture of developer productivity is a mistake I see teams making over and over again. DORA metrics tell you what already happened in your pipeline. They don’t tell you what’s getting in the way and impeding developers’ ability to be more productive.
That’s where SPACE earns its place on the dashboard. The most productive engineering teams are the ones with the healthiest engineering cultures, and you cannot see culture in a deployment frequency chart. If you measure only what’s easy to measure, you’ll optimize for what’s easy to measure, and you’ll quietly lose everything else.
If your team is only using DORA metrics today, you’ve got a good start, but, I strongly suggest pairing that with some of the SPACE dimensions, especially Satisfaction and Well-being. Run developer sentiment surveys. Talk to your engineers. Look at your pipeline metrics alongside your people metrics. The two together tell you a holistic story that neither one tells on its own, and the team you build with that fuller picture will be a much healthier one!
Sources
Kim, G., Humble, J., & Forsgren, N. (2018). Accelerate: The Science of Lean Software and DevOps. IT Revolution Press.
Forsgren, N., Storey, M., Maddila, C., Zimmermann, T., Houck, B., & Butler, J. (2021). The SPACE of Developer Productivity: There’s more to it than you think. ACM Queue.
Tacho, L., & Orosz, G. (2022). Measuring Engineering Productivity. The Pragmatic Engineer.
Forsgren, N., Storey, M., Noda, A., Greiler, M., & Orosz, G. (2023). Developer Productivity: A New Framework. The Pragmatic Engineer.
Forsgren, N., & Orosz, G. (2025). Developer Productivity with Dr. Nicole Forsgren. The Pragmatic Engineer.